What resonates best when launching a Global Software Solution?
Developers at a major enterprise solutions provider faced challenges when working on their internal platform. The platform contains a wide range of disconnected services, making it difficult to manage end-to-end solution development.
In response, the provider developed a low-code solution that provides greater integration across these tools and services. It also incorporates generative AI to facilitate code development and fosters collaboration between Business and App Development teams on the user side.
Objective
The company is planning a global release of the new platform later this year and wanted to test two marketing messages with developers in India and the US, two of its primary markets, to identify which message and claim would resonate best with each audience.
Approach
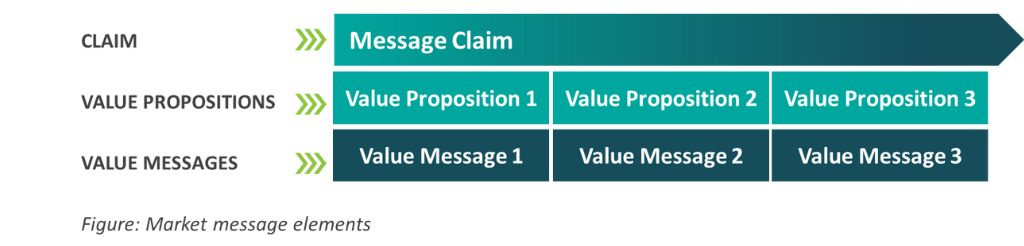
The company’s marketing team built its marketing messages around 4 elements:
- A claim
- Three value propositions
- Three value messages, one for each value proposition
- Proof points for each value message and value proposition
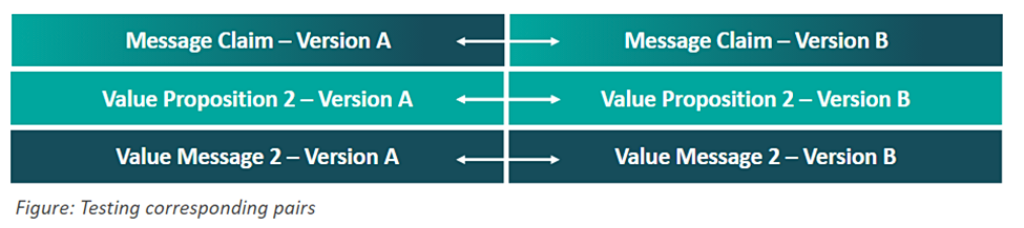
Version B included the company’s name while Message A was phrased in generic terms . However, all respondents knew that the messages pertained to a solution being developed by the client.
Phronesis Partners recommended a simple monadic design (i.e., participants were shown each message in isolation) for A/B testing as the value propositions and value messages had a one-to-one correspondence, allowing for testing in corresponding pairs.
A questionnaire was developed to test:
- the degree to which the message claims covered the solution’s primary functionalities for developers, including coding simplicity, accelerated development speed, collaboration ease, and plug-and-play development
- the relevance and clarity of corresponding pairs of value messages
- whether corresponding pairs of value propositions effectively conveyed the intended meaning of the associated value messages,
The survey was tested with 150 application Developers and Application Development Project Managers in each of the two target geographies, India and the US. 75 respondents evaluated each version (A/B) of the marketing message. Each respondent was randomly assigned a marketing message version for evaluation. We also controlled for whether respondents were already using one of the client’s solutions to help ensure that a similar group, in terms of prior exposure to the client’s solutions, evaluated each message. We also controlled for the proportion of Project Managers to Developers who evaluated each message.
 We collected responses via an online survey, where respondents were presented with the message components as stimuli for their evaluation. Besides testing specific components, the complete marketing message, including the Claims, Value Propositions, and Value Messages, was also presented to participants in the format created by the client.
Results
Each set of proof points for each value message was evaluated separately, with respondents classifying them as “Must haves”, “Nice to haves”, or “Not Important”. We didn’t need a direct comparison because, once a message was chosen, our goal was to establish the priority order for incorporating proof points into marketing materials. This method also assisted us in understanding what developers seek when evaluating solutions.
We conducted comparisons of all attributes for each message component between the two message versions using relevant statistical tests. A composite score for each prospective marketing communication (MarCom) message, considering its performance across all components was also calculated. This entailed converting the 1−7 scales to 0−100 scales and applying weighted averages, with Claims assigned the highest weight and value messages the lowest weight. This weighting followed the typical order in which the target audience would typically encounter the message, from top to bottom.
The message featuring the client’s name in the Message Claim (Version B) performed significantly better in both countries and received higher scores across various parameters. However, the winning MarCom message (Version B) scored significantly lower on one value message compared to the corresponding value message in the losing MarCom message both in India and overall (combining both countries). In the US, there was no significant difference between these value messages.
Considering the significant broad correspondence in the content of these value messages and propositions, especially with the winning value message having a broader scope, our recommendation was to substitute this specific value message and proposition in the winning MarCom message with the corresponding ones from the losing MarCom message.
For each value message, we managed to prioritize the most essential proof points by ranking them based on their perceived importance (using a proportion ranking as a must-have). Additionally, as the proof points were organized into distinct groups within each value proposition and value message, we calculated the average rank across the individual items within these groups. This allowed us to determine the sequence of proof points within each group using the rank assigned to each item.
Outcome
Our research provided the company with valuable insights that enabled them to make informed decisions regarding their global MarCom messaging. Leveraging our recommendations, they plan to roll out the winning MarCom message later this year, including their name in the message claim. This message is expected to resonate with their target audience on a global scale and improve audience engagement with the new solution.
Contact Us
Get in touch to discuss our research services and to find out more.
